
Updated: 26 October 2026 | IPL Head-to-Head Stats
The DC vs CSK head-to-head record shows Chennai Super Kings leading Delhi Capitals 21–12 in 33 IPL matches through 2026. Explore their complete match history, year-wise results, key player statistics, venue records and memorable encounters.
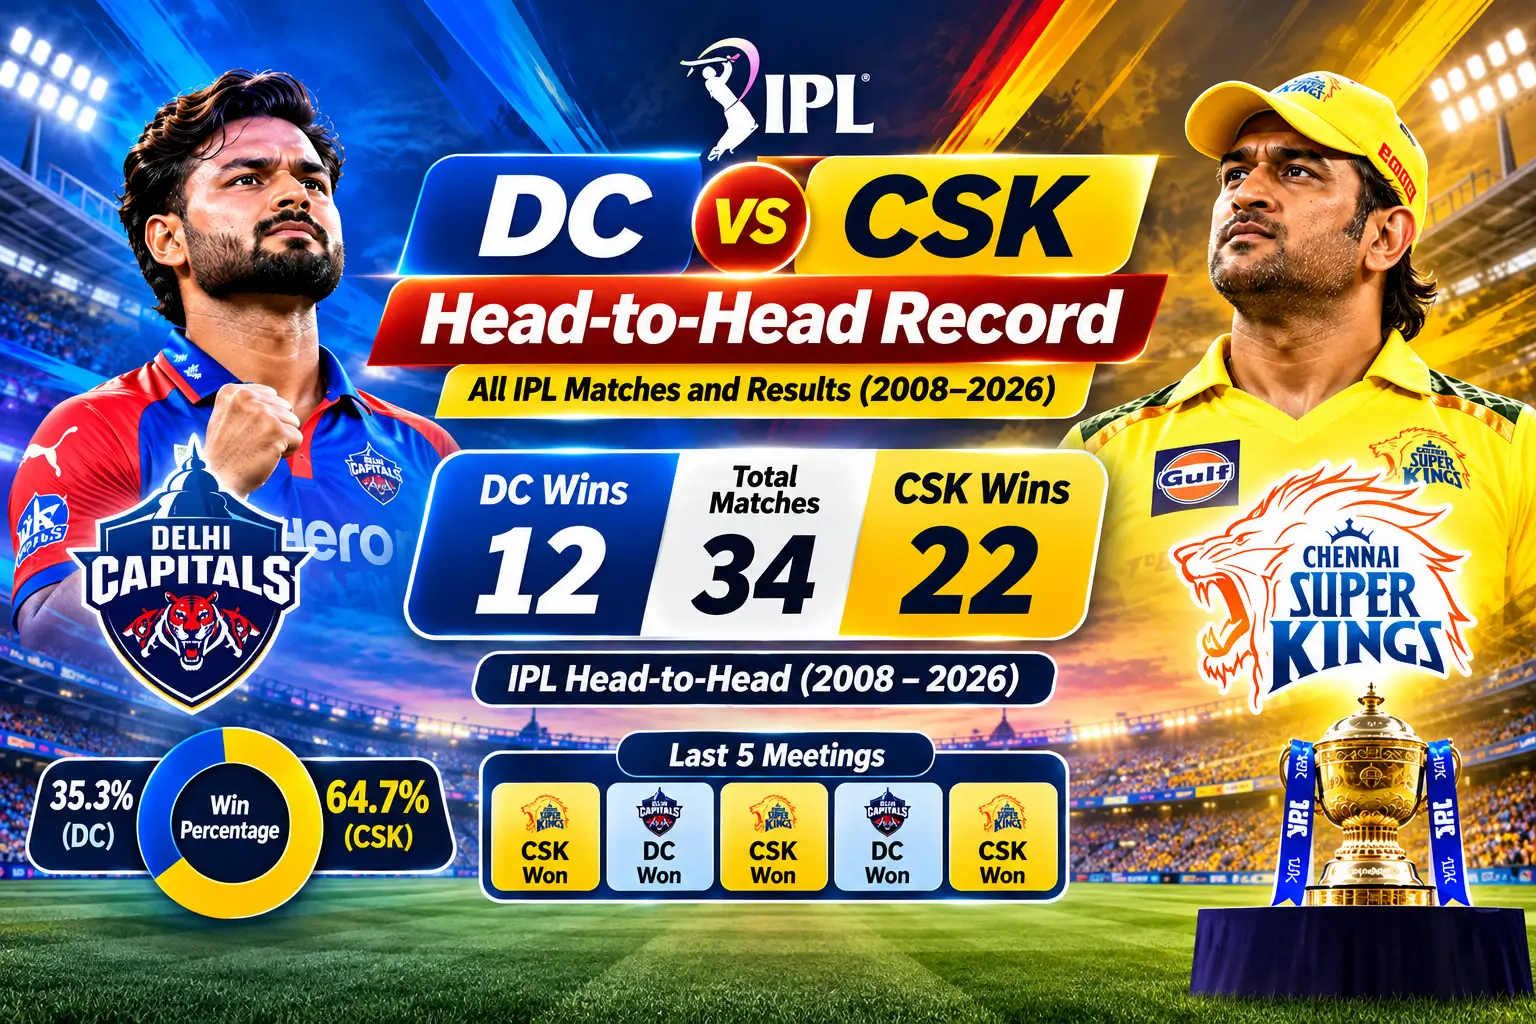
DC vs CSK Head-to-Head Record in IPL
Overall IPL win share
🟨 Chennai Super Kings: 63.64% | 🟦 Delhi Capitals: 36.36%
| Statistic | Record |
|---|---|
| Total meetings | 33 |
| CSK victories | 21 |
| DC victories | 12 |
| No result | 0 |
| First meeting | 2008 |
| Latest meeting | 5 May 2026 |
| Latest winner | Chennai Super Kings |
| Playoff meetings | 3; CSK won all three |
Chennai’s overall advantage reflects strong performances across multiple eras. Their ability to win at home, away and in knockout matches has been particularly important. Delhi, meanwhile, have challenged Chennai most effectively when their top order has provided quick starts and their bowling attack has defended totals with discipline.
DC vs CSK Head-to-Head Year-Wise Results
The season-by-season record shows when each side controlled the rivalry. Chennai enjoyed particularly strong campaigns in 2019 and 2023, while Delhi won both league encounters in 2020 and two of three meetings in 2021.
| IPL season | Matches | CSK wins | DC wins |
|---|---|---|---|
| 2026 | 2 | 2 | 0 |
| 2025 | 1 | 0 | 1 |
| 2024 | 1 | 0 | 1 |
| 2023 | 2 | 2 | 0 |
| 2022 | 1 | 1 | 0 |
| 2021 | 3 | 1 | 2 |
| 2020 | 2 | 0 | 2 |
| 2019 | 3 | 3 | 0 |
| 2018 | 2 | 1 | 1 |
| 2015 | 2 | 1 | 1 |
| 2014 | 2 | 2 | 0 |
| 2013 | 2 | 2 | 0 |
| 2012 | 3 | 2 | 1 |
| 2011 | 1 | 1 | 0 |
| 2010 | 2 | 1 | 1 |
| 2009 | 2 | 1 | 1 |
| 2008 | 2 | 1 | 1 |
CSK did not play in IPL 2016 or 2017. The table includes league and playoff matches.
Season-by-season wins
For a wider comparison of league positions, season performance and rankings, read our Delhi Capitals vs Chennai Super Kings standings analysis. The standings page complements this head-to-head guide rather than repeating its full match history.
DC vs CSK All IPL Matches and Results (2008–2026)
The complete list below is arranged in reverse chronological order. It combines league fixtures and playoff encounters so that readers can compare outcomes across different tournament stages.
| Season | Venue | Winner | Margin |
|---|---|---|---|
| 2026 | Delhi | CSK | 8 wickets |
| 2026 | Chennai | CSK | 23 runs |
| 2025 | Chennai | DC | 25 runs |
| 2024 | Visakhapatnam | DC | 20 runs |
| 2023 | Delhi | CSK | 77 runs |
| 2023 | Chennai | CSK | 27 runs |
| 2022 | Navi Mumbai | CSK | 91 runs |
| 2021 | Dubai, Qualifier 1 | CSK | 4 wickets |
| 2021 | Dubai | DC | 3 wickets |
| 2021 | Mumbai | DC | 7 wickets |
| 2020 | Sharjah | DC | 5 wickets |
| 2020 | Dubai | DC | 44 runs |
| 2019 | Visakhapatnam, Qualifier 2 | CSK | 6 wickets |
| 2019 | Chennai | CSK | 80 runs |
| 2019 | Delhi | CSK | 6 wickets |
| 2018 | Delhi | DC | 34 runs |
| 2018 | Pune | CSK | 13 runs |
| 2015 | Raipur | DC | 6 wickets |
| 2015 | Chennai | CSK | 1 run |
| 2014 | Delhi | CSK | 8 wickets |
| 2014 | Abu Dhabi | CSK | 93 runs |
| 2013 | Chennai | CSK | 33 runs |
| 2013 | Delhi | CSK | 86 runs |
| 2012 | Chennai, Qualifier 2 | CSK | 86 runs |
| 2012 | Chennai | CSK | 9 wickets |
| 2012 | Delhi | DC | 8 wickets |
| 2011 | Chennai | CSK | 18 runs |
| 2010 | Chennai | DC | 6 wickets |
| 2010 | Delhi | CSK | 5 wickets |
| 2009 | Johannesburg | CSK | 18 runs |
| 2009 | Durban | DC | 9 runs |
| 2008 | Delhi | CSK | 4 wickets |
| 2008 | Chennai | DC | 8 wickets |
CSK’s longest stretches of success have generally coincided with strong bowling units and experienced batting combinations. Delhi’s winning runs demonstrate that the contest is far from one-sided in individual seasons. A head-to-head lead describes the past; it does not guarantee the result of the next match.
DC vs CSK Last Five IPL Matches
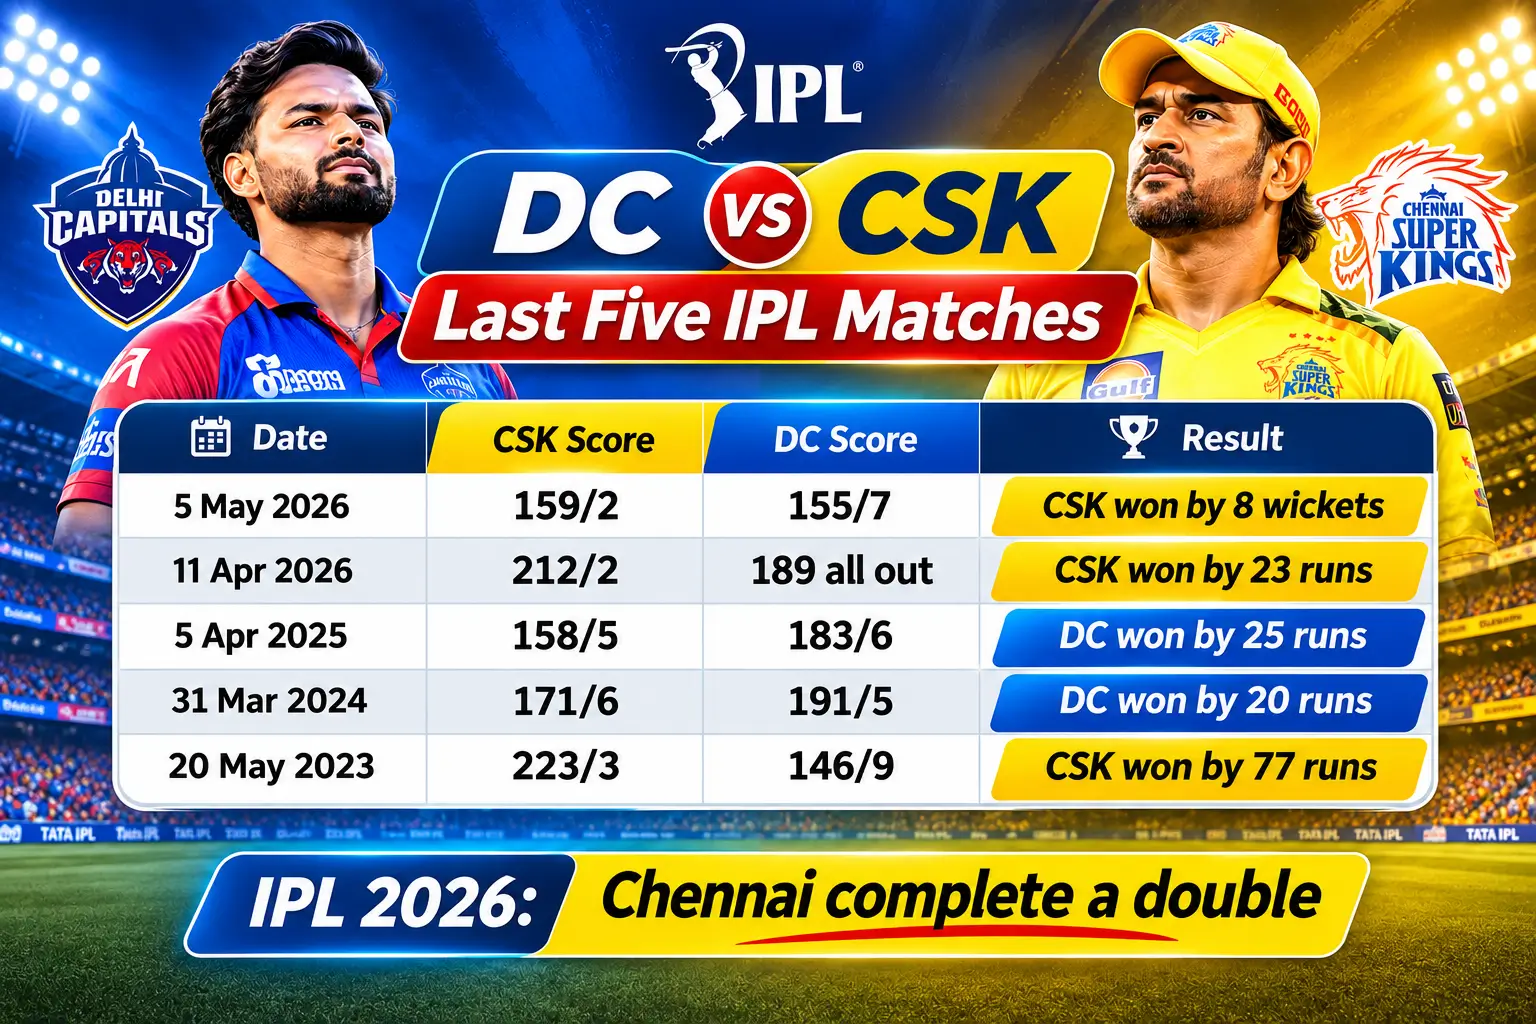
| Date | CSK score | DC score | Result |
|---|---|---|---|
| 5 May 2026 | 159/2 | 155/7 | CSK won by 8 wickets |
| 11 Apr 2026 | 212/2 | 189 all out | CSK won by 23 runs |
| 5 Apr 2025 | 158/5 | 183/6 | DC won by 25 runs |
| 31 Mar 2024 | 171/6 | 191/5 | DC won by 20 runs |
| 20 May 2023 | 223/3 | 146/9 | CSK won by 77 runs |
IPL 2026: Chennai complete a double
Chennai won both fixtures in 2026. They posted 212/2 in the first encounter and defended that score by 23 runs. In the return meeting in Delhi, CSK chased 155/7, finishing on 159/2 in 17.3 overs. The eight-wicket win strengthened Chennai’s lead in the overall record.
IPL 2025: Delhi win at Chepauk
Delhi scored 183/6 and restricted Chennai to 158/5 for a 25-run victory. The result mattered because away wins at MA Chidambaram Stadium are often difficult to secure. Delhi’s batting set up the match, but the bowlers ensured the target remained out of reach.
IPL 2024: Delhi win in Visakhapatnam
Delhi’s 191/5 proved sufficient as Chennai finished on 171/6. The 20-run margin highlighted Delhi’s ability to defend a challenging score against a batting line-up known for chasing under pressure.
IPL 2023: Chennai dominate in Delhi
CSK amassed 223/3 and held Delhi to 146/9, winning by 77 runs. This result illustrated how a powerful opening platform and sustained middle-over pressure can decide a T20 match before the closing overs.
DC vs CSK Venue-Wise IPL Head-to-Head Record
The venue figures below cover selected grounds only, so they should not be added together to infer a complete home-and-away breakdown. For historical consistency, Delhi Daredevils matches before the franchise’s renaming are included in DC’s overall results.
Venue records add context to the overall win-loss figures. Chennai have historically been effective at Chepauk, where slower surfaces can reward accurate spin and changes of pace. Their record in Delhi also shows an ability to adapt to away conditions.
| Venue | Matches | CSK wins | DC wins |
|---|---|---|---|
| MA Chidambaram Stadium, Chennai | 11 | 8 | 3 |
| Arun Jaitley Stadium, Delhi | 9 | 7 | 2 |
| Dubai International Stadium | 3 | 1 | 2 |
| ACA-VDCA Stadium, Visakhapatnam | 2 | 1 | 1 |
Selected venues only; not an exhaustive breakdown of all grounds.
These differences should be interpreted alongside squad composition and pitch preparation. A ground that favoured spin in one season may play differently in another. Toss decisions, dew and boundary dimensions can also change the tactical balance.
Highest Team Totals in DC vs CSK Matches
Several high-scoring Chennai innings stand out in the history of this fixture. Their best totals have often involved top-order partnerships that allowed finishers to attack immediately rather than rebuild after early wickets.
| Season | CSK total | Context |
|---|---|---|
| 2023 | 223/3 | Highest CSK total against Delhi |
| 2012 | 222/5 | Playoff batting performance |
| 2026 | 212/2 | Strong top-order innings |
| 2018 | 211/4 | 200-plus total |
| 2022 | 208/6 | Set up a 91-run win |
CSK’s leading innings totals against Delhi
Large totals are not the only path to victory. Chennai have also defended moderate scores through tight middle overs, while Delhi have chased targets by preserving wickets and timing their acceleration. The scoreboard should therefore be considered alongside bowling conditions and the phase-by-phase scoring rate.
Leading Run-Scorers in DC vs CSK: Historical Snapshot
Long-serving players dominate the historical batting chart. MS Dhoni and Suresh Raina made repeated contributions for Chennai, while Shikhar Dhawan and Rishabh Pant were important figures for Delhi in different periods.
| Player | Runs | Average |
|---|---|---|
| MS Dhoni | 696 | 38.67 |
| Suresh Raina | 552 | 29.05 |
| Shikhar Dhawan | 433 | 54.13 |
| Rishabh Pant | 375 | 46.88 |
| Murali Vijay | 346 | 34.60 |
| Faf du Plessis | 334 | 27.83 |
| Prithvi Shaw | 321 | 26.75 |
Data-quality note: these named-player figures come from the historical snapshot in the source article. An exact statistical cutoff and each player’s team-specific innings must be confirmed before describing them as current records through IPL 2026.
Leading historical run-scorers
Dhoni’s tally illustrates his longevity and value in finishing innings. Raina’s contributions came from his ability to score quickly against both pace and spin. Dhawan provided a more measured opening approach, while Pant’s attacking batting frequently changed the tempo of an innings. These are historical records, not a list of current squad members.
Leading Wicket-Takers in DC vs CSK: Historical Snapshot
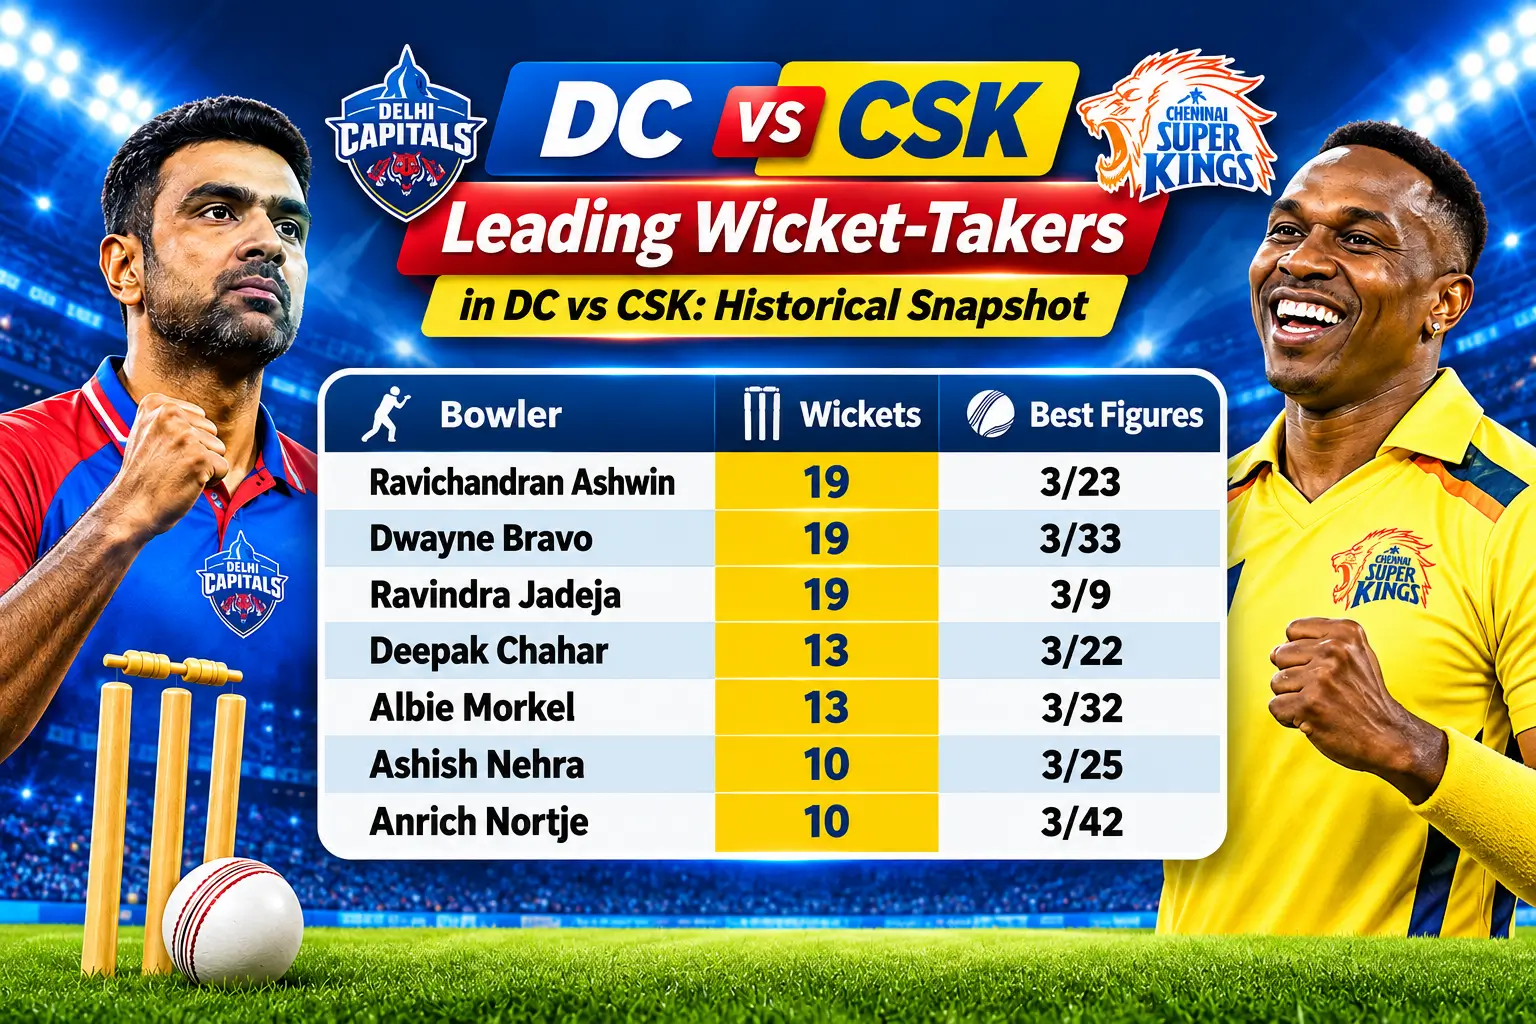
| Bowler | Wickets | Best figures |
|---|---|---|
| Ravichandran Ashwin | 19 | 3/23 |
| Dwayne Bravo | 19 | 3/33 |
| Ravindra Jadeja | 19 | 3/9 |
| Deepak Chahar | 13 | 3/22 |
| Albie Morkel | 13 | 3/32 |
| Ashish Nehra | 10 | 3/25 |
| Anrich Nortje | 10 | 3/42 |
Player-wicket figures above are retained from the source article as a historical snapshot; they are not independently established as a complete 2026 leaderboard.
Ashwin, Bravo and Jadeja share the lead in this historical bowling dataset. Their success underlines the importance of accuracy and variation. Spinners have used changes of flight and speed to restrict scoring, while seamers have relied on yorkers, slower balls and disciplined lengths during the powerplay and death overs.
DC vs CSK IPL Playoff Head-to-Head Record
Chennai’s record is especially impressive in the knockout stages. The teams have met three times in IPL playoffs, with CSK winning every match.
| Season | Stage | Winner | Margin |
|---|---|---|---|
| 2012 | Qualifier 2 | CSK | 86 runs |
| 2019 | Qualifier 2 | CSK | 6 wickets |
| 2021 | Qualifier 1 | CSK | 4 wickets |
These matches demonstrate Chennai’s historical ability to perform under pressure. However, playoff success in previous seasons should not be treated as a forecast: team personnel, conditions and tactics evolve significantly over time.
What Makes the DC vs CSK Rivalry Special?
The contrast between the franchises is central to the rivalry. Chennai have built their reputation around continuity, defined roles and experienced leadership. Delhi have often featured energetic batting combinations, emerging Indian players and high-quality pace options.
Matches between them have produced narrow finishes, imposing first-innings totals, successful run chases and significant playoff victories. Chennai’s historical advantage is clear, but Delhi’s victories in 2024 and 2025 show how quickly a season’s momentum can shift.
For readers comparing future meetings, three factors are especially useful: the strength of each side’s current playing XI, recent form at the scheduled venue and how the bowling attacks match up against the opposition’s leading batters. Historical win percentages are helpful context, not a substitute for current information.
DC vs CSK Head-to-Head FAQs
Conclusion: Who Dominates DC vs CSK?
The DC vs CSK head-to-head record favours Chennai Super Kings, who have won 21 of 33 meetings through 2026. Their advantage is supported by strong playoff results, experienced match-winners and success at multiple venues. Delhi Capitals have nevertheless enjoyed important periods of success, particularly in 2020 and 2021 and through victories in 2024 and 2025.
Chennai’s two wins in 2026 extended their overall lead. Future meetings will add new chapters to the rivalry, and this match-by-match record can serve as a reference for tracking those changes.